Visualize Similarities Between Companies With Graph Database
Build and Analyze Graph Database with Neo4j
Motivation
Have you ever been curious about the similarities between different companies? Wouldn’t it be nice if you can visualize their relationships like below?
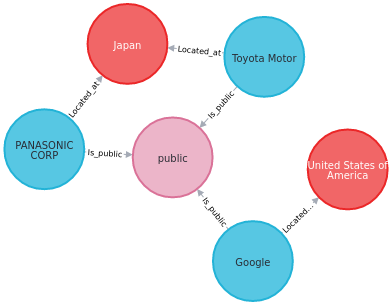
That is when graph database and Neo4j come in handy. In my latest article, you will learn what Neo4j is and how to use it to analyze the similarities between artificial intelligence companies.
What is a Graph Database?
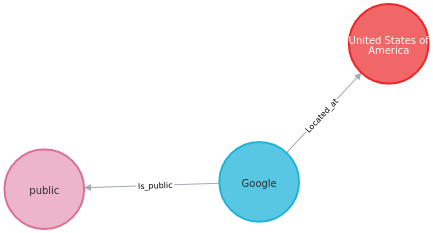
A graph data structure consists of nodes that can be connected by relationships.
In the graph below, there are:
- Nodes describe entities (i.e, Google, public, United States of America)
- Relationships describe connections between source nodes and target nodes (i.e, Google is located in the United States of America)
What is Neo4j?
Neo4j is the world’s leading graph database that allows you to quickly manage, store, and traverse nodes and relationships.
You can download the Desktop version of Neo4j for free here.
To learn how Neo4j works, let’s use it to find the similarities between artificial intelligence companies.
Get the Data
The dataset of artificial intelligence companies can be obtained from Diffbot’s knowledge graph. The data is being made available with the public domain CC0 license. Find out how you get the data from Diffbot here.
The image below shows the options I used to get organizations that are classified as Artificial Intelligence Companies in the Search section.
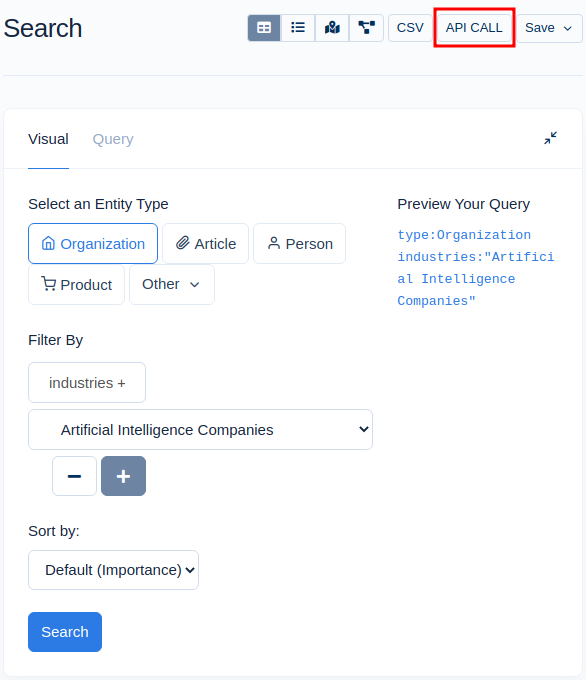
Alternatively, you can download the dataset from my Google Drive. Note that this dataset only contains 1000 artificial intelligence companies in the world.
Next, we will load and view the keys of the first company:
dict_keys(['twitterUri', 'nbActiveEmployeeEdges', 'type', 'allNames', 'revenue', 'yearlyRevenues', 'logo', 'id', 'stock', 'nbOrigins', 'sicClassification', 'foundingDate', 'image', 'images', 'wikipediaUri', 'irsEmployerIdentificationNumbers', 'diffbotUri', 'nbIncomingEdges', 'nbEmployeesMin', 'ipo', 'parentCompany', 'angellistUri', 'name', 'motto', 'nbEmployeesMax', 'totalInvestment', 'allOriginHashes', 'linkedInUri', 'naicsClassification', 'nbEmployees', 'githubUri', 'isDissolved', 'importance', 'origin', 'description', 'homepageUri', 'founders', 'ceo', 'investments', 'blogUri', 'descriptors', 'isNonProfit', 'origins', 'isPublic', 'categories', 'crawlTimestamp', 'nbUniqueInvestors', 'facebookUri', 'secCentralIndexKeys', 'summary', 'types', 'boardMembers', 'allUris', 'nbLocations', 'crunchbaseUri', 'industries', 'allDescriptions', 'location', 'locations', 'subsidiaries'])Cool! It looks like the data provides us with some interesting information about a company such as revenue , foundingDate , andnbEmployees . Let’s put these useful pieces of information into a pandas DataFrame.
Next, we will process the data to be used by Neo4j.
Now the data is ready to be used in Neo4j!
df.to_csv("artificial_intelligence.csv", index=False)Next, create a name and a password for the database.

After the database is created, we can import the local data to Neo4j by clicking the three dots next to the database, then clicking “Open folder” and “Import”.
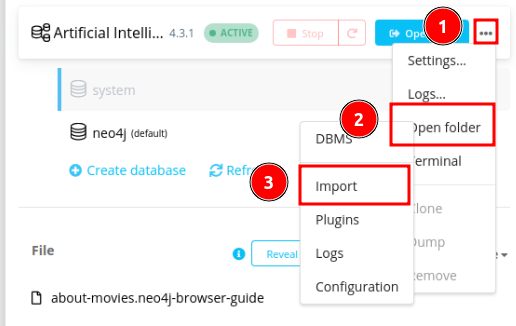
A folder named “import” will pop up on your window. Simply drag the dataset from your local directory to the “import” file to load the dataset in Neo4j.

After the database is created, click “Start” then click “Open” to open the database in Neo4j Browser.
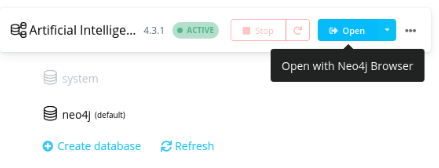
And you should see an interface like below:

Neo4j uses Cypher query language to allow users to store and retrieve data from the graph database. Cypher syntax is easy to learn and short to write. In the next sections, we will learn how to use Cypher to manipulate our data.
Load and View Data
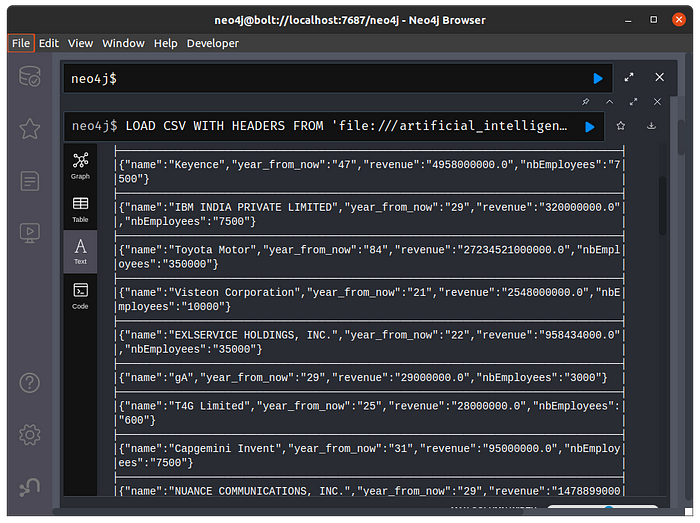
We can read data from a CSV using LOAD CSV WITH HEADERS FROM and view the data using RETURN . Click the Run button to run the query.

The two initial records in the results should look like below:
Create Nodes
Now let’s create some nodes using the company column. We can either use CREATE or MERGE to create nodes. However, I prefer to useMERGE since it will create new nodes only if the data does not exist in the database. This helps avoid creating duplicate data.
In the code above:
- We create the node of type
Companyand create the attributes of this node using the columns in our data. LIMIT 50limits the results to 50 companies.
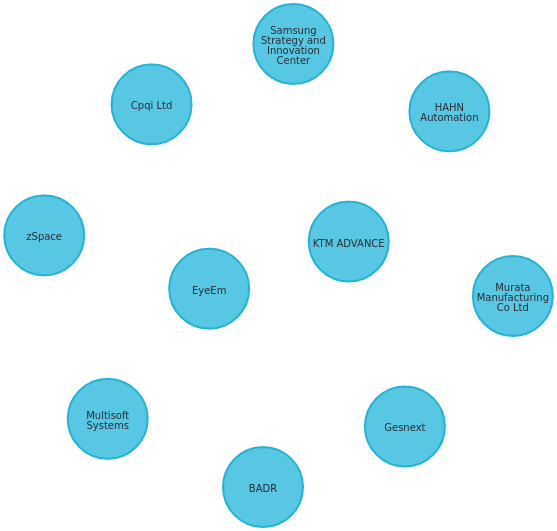
After clicking the Graph button, you should see nodes that represent different companies like below!


You can also view the table of different companies by clicking Table or Text .
Cool! Now let’s create some more node types.


In the graph above, blue nodes represent Company , red nodes represent Location , and light pink nodes represent IsPublic . By looking at the colors of the nodes, we can easily distinguish between different node types!
Create Relationships Between Nodes
Nodes without connections are not very fun and meaningful. We can use the same MERGE clause to create relationships between nodes.
Note that MERGE (c)-[:Located_at]->(l) tells Neo4j that the nodes of type Company are Located_at the nodes of type Location .
Run the query and you should get a graph like below:

Pretty cool!
Search For Patterns in Database
Now we have set up the connections. Let’s use the MATCH clause to search for some specific the patterns in the database.
Get Nodes with a Label
We can use MATCH to get all nodes with a specific label, such as Company :
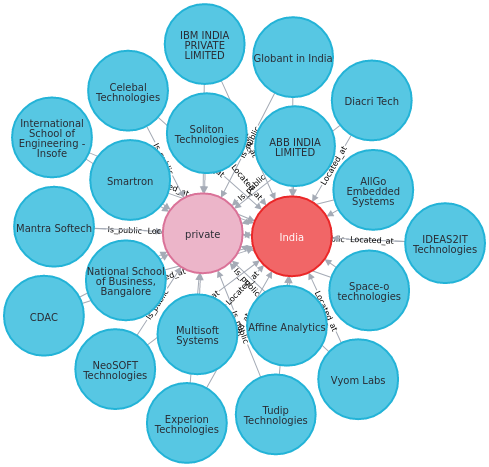
To find all nodes that are connected to a specific node, click that node, then click the graph symbol. If two nodes have similar connections, they will be connected to each other through their similar nodes.

Get Related Node
To search for nodes that connect to a specific node, add -- to the MATCH clause
For example, to find all companies that are located in Japan, we use:

Get Nodes Based on Multiple Relationships
What if we want to get private companies that are located in India? Neo4j allows you to specify multiple relationships using MATCH (node1)--(node2)--(node3) :
Pretty cool!
Get Nodes Using Where Clause
We can also filter nodes using the WHERE clause. The WHERE clause in Cypher is very similar to the WHERE clause in SQL.
Let’s use the WHERE clause find US companies with revenue above the $24M. We will use the function toFloat to turn the variable c.revenue of type string into type float.
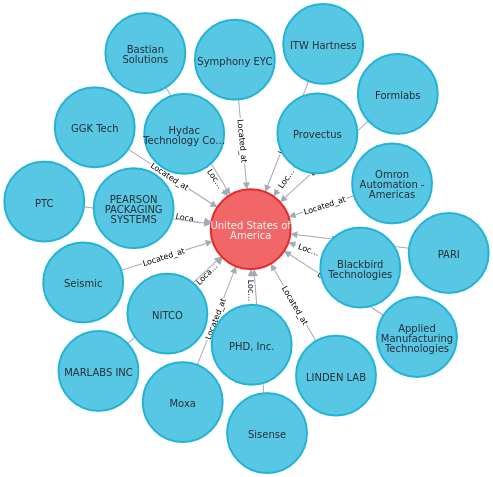
Find public companies that are located in the US with revenue over $24M:

The result looks a little bit messy. What if we just want to observe some certain relationships such as public companies?
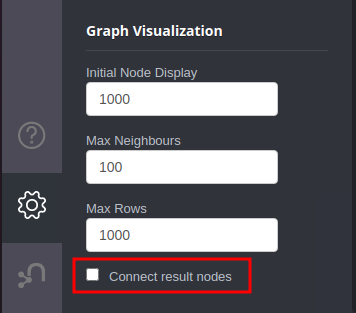
Start with unchecking the box “Connect result nodes” in the Browser Settings tab at the bottom left corner, then rerun the query.
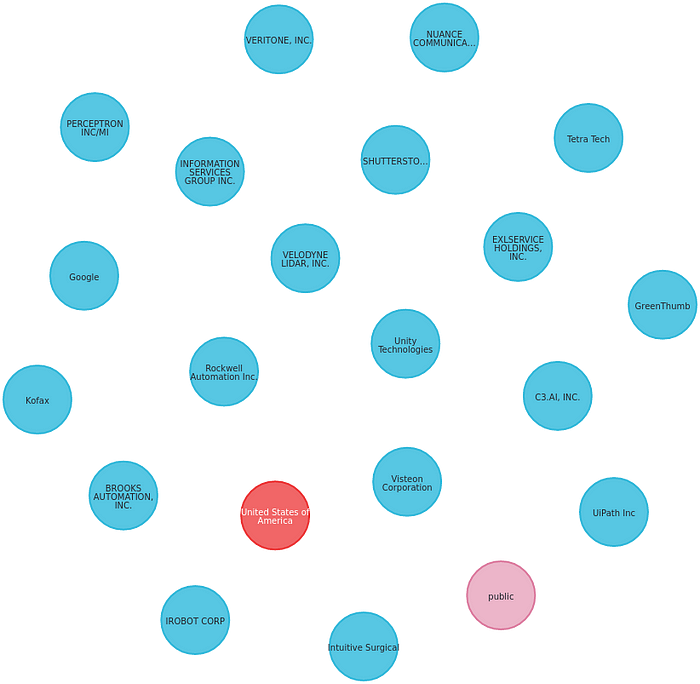
And all connections will be removed.
Then we add the relationship [r1: Is_public ]between 2 node types c:Company and (p: IsPublic) .
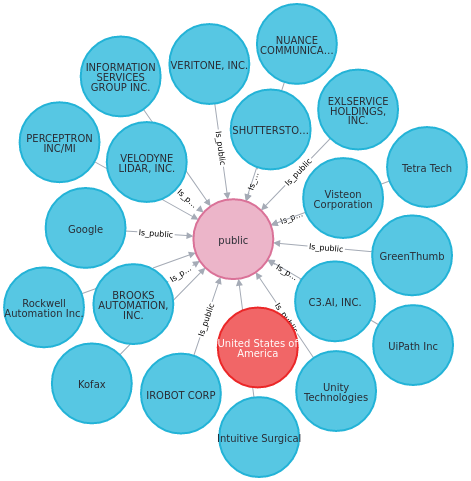
Aha! Now we see only the relationship Is_public between nodes.
Alternatively, we can just return the nodes of type Company :
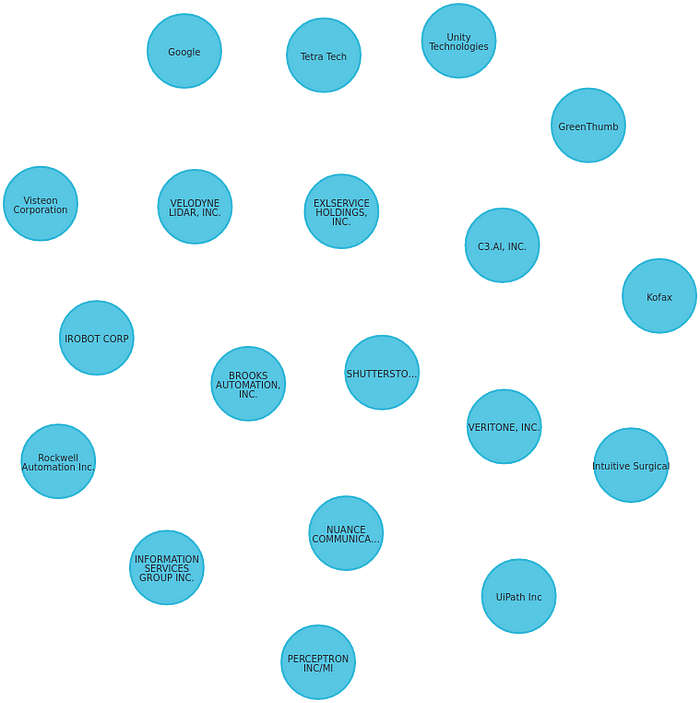
Nice!
Find US companies that have been around for less than 10 years but earned over $24M in revenue:

There are only 2 companies among 800+ artificial intelligence companies that fit this filter. That makes sense since it is pretty rare for companies to make than 24M while not being around for too long.
Aggregating Functions
Just like SQL, Neo4j also provides aggregating functions that allow you calculate an aggregated value over a set of values. We will go through some of these aggregating functions here.
avg — Get Average Value
To get the average value of a set of values, use the avg() function. We will use this function to find US companies with revenues above the average revenue of all US companies.
In the code above, we use the WITH avg(toFloat(c.revenue)) AS revenue_threshold to get the average value before passing it on to the following query part.
Output:

collect — Get a Aggregated List
The function collect() returns a single aggregated list containing the values specified by an expression.
For example, we can use collect to get a list of locations’ names:
Output:
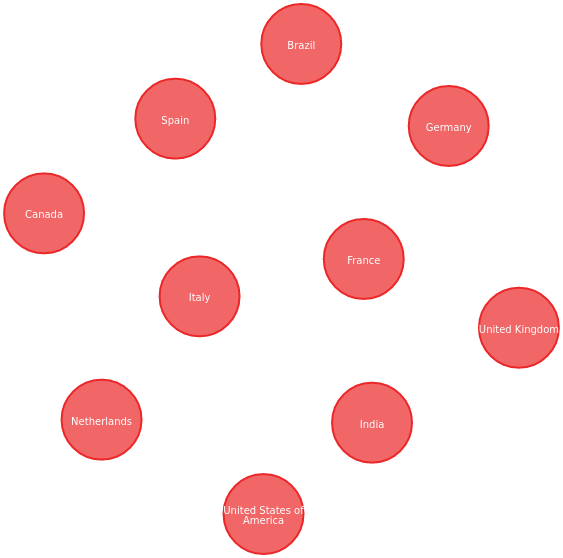
We can also use this function get the top 10 locations where the most of artificial intelligence companies are located at.
In the code above, we turn the relationships into a list, then order the locations by their number of relationships using ORDER BY SIZE(companies).
Output:
count(*) — Count Number of Nodes
Instead of manually counting the number of nodes, we can use count(*) to count the total number of result nodes.
Output:
Aha! 19 public artificial intelligence companies located in the US earned over 24M dollars.
percentileCont — Get the Percentile of a Given Value
percentileCont() will return the percentile of the given value over a group. Let’s use this function to get all companies with number of employees above the median value.
There are 183 artificial intelligence companies in the US with number of employees above the median value.
Conclusion
Congratulations! You have just learned how to use Neo4j to analyze artificial intelligence companies around the world. I hope this article will give you the motivation to explore your own dataset with Neo4j.
Since it takes only several lines of code to gain in depth understanding of your dataset, why not give Neo4j a try?
Feel free to play and fork the source code of this article here:
I like to write about basic data science concepts and play with different algorithms and data science tools. You could connect with me on LinkedIn and Twitter.
Star this repo if you want to check out the codes for all of the articles I have written. Follow me on Medium to stay informed with my latest data science articles like these:
https://towardsdatascience.com/build-and-analyze-knowledge-graphs-with-diffbot-2af83065ade0
